

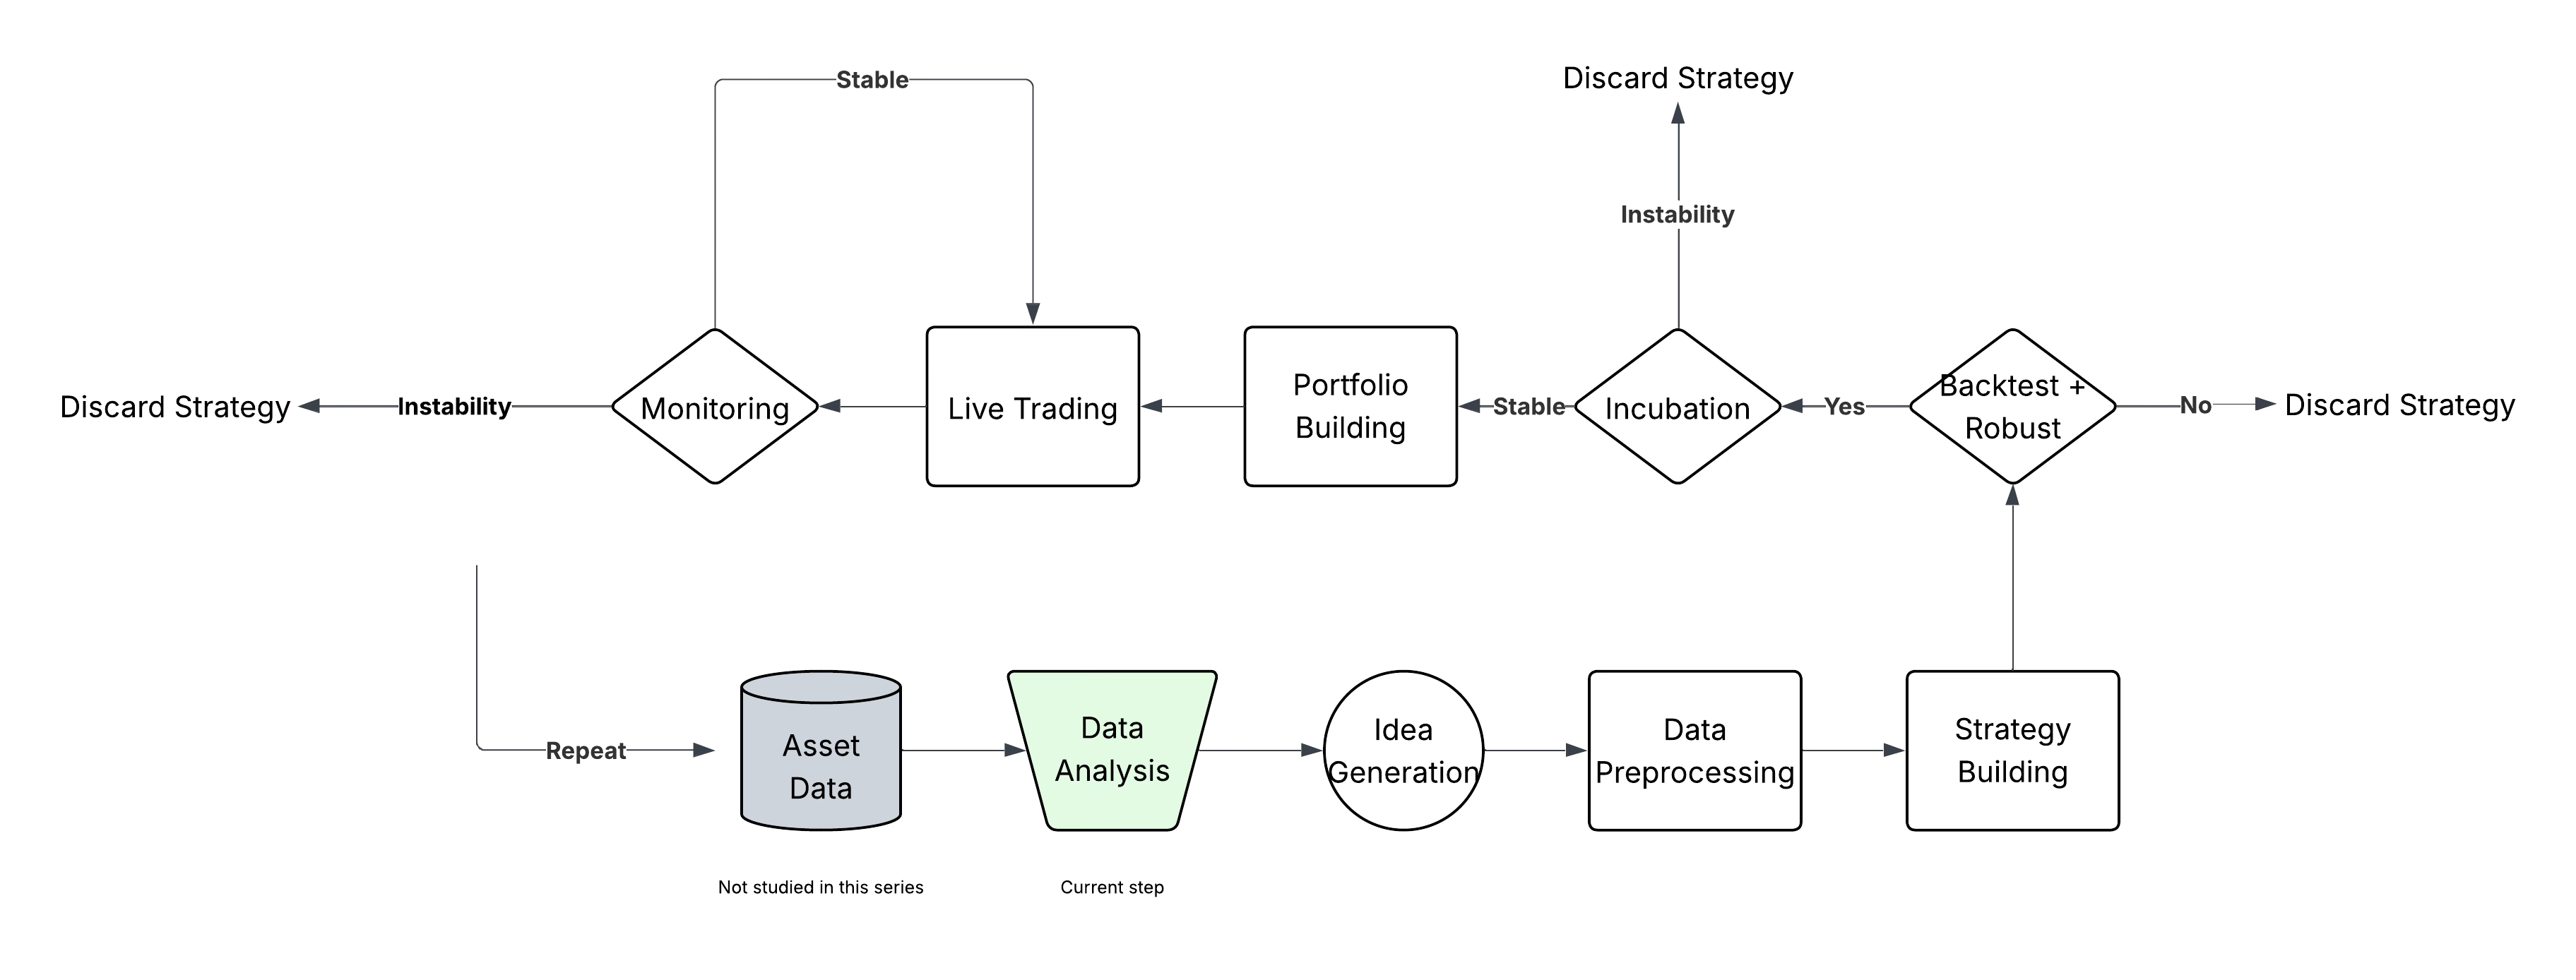
Data Analysis (Before Everything Starts) (1/8)
Early insights often come from simple questions, not complex models.

Before you build any strategy, you need to understand what you’re dealing with. Not at a surface level, but enough to know what kind of data you're working with, what’s special about it, and what relationships might be worth exploring.
This first step isn’t the most glamorous. There’s no signal yet, no alpha, no backtest. But it's where every real process should begin. You’re not trying to be clever, you're trying to learn. You take a small chunk of your data, usually the start of the sample, and you dig into it with a simple mindset: “What’s going on here?”
That’s what this newsletter is about. Step 1 in the Strategy Building Process: Data Analysis.
Not in the machine learning sense. In the exploratory sense. What asset is this? What does it tend to do? Do some features hint at something interesting? Can I spot a repeatable condition or regime?
This isn’t the step where you prove anything. It’s the step where you get curious, and start building a notebook of leads. In the next issue, we’ll see how to turn those leads into strategy ideas. But for now, let’s just look around.
1. What Should You Look For?
At this stage, you're not modeling yet, you're just observing.
Your goal is to scan the data and ask simple but useful questions like:
What kind of asset is it?
Equity, crypto, future? Volatile or stable? Liquid or not? Understanding the asset is key to setting expectations.
Are there obvious regimes or shifts?
Plot the price, volatility, volume. Look for distinct phases. These often explain why certain signals work only part of the time.
What’s the return distribution like?
Are there outliers? Fat tails? A skew? This gives you a sense of how noisy or asymmetric your target might be.
Do some features hint at label changes?
Use simple techniques like percentile slicing. For instance, volatility might not correlate linearly with your label, but above the 80th percentile, it might shift class proportions significantly.
Can I simplify the problem by conditioning?
Try looking at the data only when certain conditions are met (e.g. high volume, high RSI). Sometimes patterns only emerge in specific contexts.
This phase is all about generating leads, not proving anything. You're building the map before you choose which path to follow.
2. Storing and Structuring Your Observations
You’re not just exploring for fun. You’re building a research pipeline.
Once you spot something interesting, a pattern, a regime shift, a potential edge, write it down. Not just in your head. Create a system that lets you revisit and build on your findings later.
It doesn’t have to be fancy. It just needs to be consistent. A few ideas:
Use a dedicated Jupyter Notebook for each dataset or idea
Tag observations by type (volatility regime, momentum, mean reversion…)
Summarize each finding with:
The context (e.g. BTC 2021–2022, 5-min data)
What you observed (e.g. “After 5% drop, 3% bounce 70% of the time”)
How you measured it (e.g. simple conditional probability)
You’re not proving anything yet, just sketching hypotheses. But if you do it well, your future self will thank you.
Real strategy design doesn’t start from a blank page. It starts from good notes.
My tip: You can summarize all the information you have about an asset in a Word or Excel file (don’t forget to include links to the relevant notebooks). I personally like using Obsidian for this. Explore the options and pick the one that suits you best. It will help you get a clear overview of your current understanding.
3. From Observations to Leads
At this point, you’ve explored your data and written down a few patterns. But don’t stop there. The goal of this first phase isn’t just to observe, it’s to spot potential leads you’ll investigate later.
Think of each observation as a clue. Some will turn into real strategies, others will go nowhere. That’s normal. What matters is turning the raw intuition into something testable later on.
A few examples of what a good lead looks like:
“High volatility periods tend to reverse faster.”
Maybe there's a mean-reversion opportunity during volatility spikes.“After a large drop, the odds of a small bounce increase.”
Could be the beginning of a bounce signal. Later, you’ll define exactly what “large” and “small” mean.“Volume dries up before breakouts.”
You might explore volume contraction as a precursor to price moves.
Again, none of this is final. You’re not optimizing yet. You’re just building a short list of ideas worth testing later.
This is how you go from data explorer to signal hunter. You’re no longer just looking, you’re starting to think in terms of predictive structure.
My tip: Write every potential lead with a short sentence and one quick plot. If you can’t explain it clearly in 10 seconds, it’s probably not ready.
Here’s the truth: the data analysis phase is where most people rush, and that’s a mistake.
You don’t need to spend months on it, but skipping this step means building your strategy on unstable ground. Taking the time to observe, question, and document your dataset helps you avoid blind spots and find angles worth digging into.
It’s not about finding a ready-to-trade signal. It’s about building your intuition and your map of the dataset. Once that’s done, your idea generation becomes faster, more focused, and way more robust.
In the next newsletter, we’ll cover how to turn those raw observations into concrete trade ideas, and what kind of questions to ask to go from “I noticed something” to “I think there’s a strategy here.”
Until then, take time to explore your data the right way. That’s where the real edge begins.
👉 If you want to go deeper into each step of the strategy building process, with real-life projects, ready-to-use templates, and 1:1 mentoring, that’s exactly what the Alpha Quant Program is for.
It’s the full roadmap I use to turn ideas into live strategies.