

⏱️ Why Time Bars Are Not Enough
From Ticks to Insight: Building Bars That Respect Market Microstructure

Most traders rely on time bars: 1-minute, 5-minute, hourly.
Why? Because that’s how every charting tool defaults. It feels intuitive. Familiar.
But here’s the problem:
Markets don’t move in time. They move in activity.
The first hour of trading sees thousands of transactions. Midnight? Almost none.
Yet time bars treat them equally, leading to oversampling during quiet periods and undersampling during peak volatility.
That’s where alternative bar types come in.
They don’t just chop time. They respond to the market’s actual rhythm, based on ticks, volume, or imbalances in buying and selling pressure.
This newsletter is based on Chapter 2 of “Advances in Financial Machine Learning” from Marco Lopez de Prado.
Actionable code available in the quantreo lib.
In this newsletter, you’ll discover:
Why time bars fail under real market conditions
How to build better structures with tick bars, volume bars, and imbalance bars
When and why to use each of them
And what more advanced bar types (tick/volume runs) we’ll explore next
Let’s rebuild the market, one smarter bar at a time.
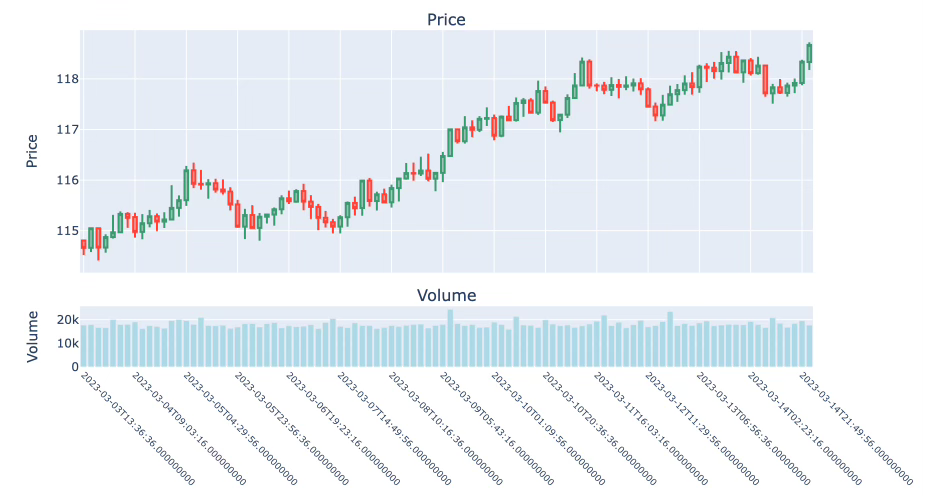
🕰️ 1. Time Bars: The Industry Standard (and Its Limits)
Time bars are the default in most trading platforms. You choose a frequency, like 1 minute, 5 minutes, or 1 hour, and aggregate all ticks that fall into each time bucket.
📊 How they work:
Each bar includes:
Open, high, low, close (OHLC)
Volume traded
Number of ticks
Time of extrema (optional)
This structure is intuitive and easy to work with, but fundamentally flawed.
⚠️ The problem:
Markets are not constant over time: Volume and volatility vary drastically across sessions.
Oversampling in quiet periods → More noise, less signal.
Undersampling during volatile periods → Loss of resolution.
"Statistical properties like serial correlation and heteroscedasticity are worsened by time bars" — Lopez de Prado
✅ When to use:
For simple, human-readable charts
When your model assumes constant sampling intervals
If you’ve accounted for session-based variability elsewhere
But if you're working on machine learning, event-based backtesting, or microstructure modeling, time bars are rarely optimal. Let’s see why.
🎯 2. Tick Bars: Normalize the Number of Observations
Tick bars fix one major flaw of time bars: instead of aggregating by fixed time intervals, they aggregate by a fixed number of trades.
📊 How they work:
A new bar is created every N ticks (e.g., 10,000). Each bar contains:
OHLC prices of the N ticks
Tick count
Duration (time it took to gather N ticks)
This approach ensures each bar has the same number of price updates, which is much more stable for modeling.
💡 Why it’s better:
More uniform statistical properties: Returns are closer to IID and Gaussian than in time bars.
Responsive to market activity: During quiet periods, fewer bars are created; during active periods, more.
Cleaner microstructure signals: You remove the influence of uneven time spacing.
✅ When to use:
For ML models that assume evenly spaced data
To reduce noise from session-based time variability
As a better baseline than time bars in most algo strategies
Tick bars are your first step into smarter data structuring — but we can go further.
💻Code Example (from quantreo lib):
tick_bars = da.bar_building.ticks_to_tick_bars(df, tick_per_bar=10_000, col_price="price", col_volume="volume", additional_metrics=[])
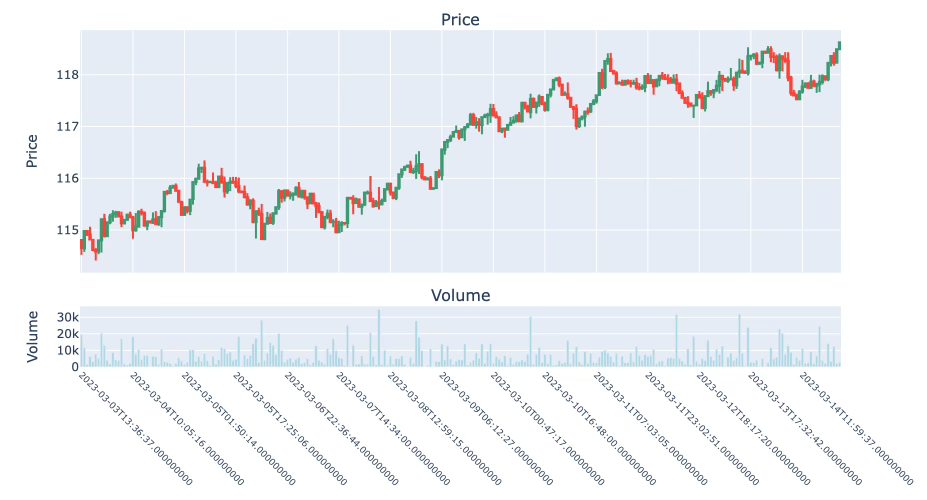
💼 3. Volume Bars: Adapt to Market Participation
Volume bars push the logic of tick bars further. Instead of counting trades (ticks), they aggregate based on the cumulative traded volume.
📊 How they work:
Each new bar is created when the sum of volume reaches a predefined threshold (e.g., 15,000 contracts). Each bar contains:
OHLC prices of the trades in that volume chunk
Number of ticks
Duration (time it took to trade that volume)
📈 Why it matters:
More relevant for execution: Market volume = market interest.
Reduces distortion from order splitting and micro-ticks with little significance.
Filters noise: Bars form more slowly during illiquid periods and faster during high activity.
✅ When to use:
When volume is your key signal (e.g., volume spikes, VWAP, accumulation)
For assets with irregular liquidity
In strategies that rely on execution timing or slippage control
Volume bars strike a better balance between data regularity and market relevance. But what if we want to go even deeper into market dynamics? Let's look at imbalance bars.
💻Code Example (from quantreo lib):
volume_bars = da.bar_building.ticks_to_volume_bars(df, volume_per_bar=15_000, col_price="price", col_volume="volume", additional_metrics=[])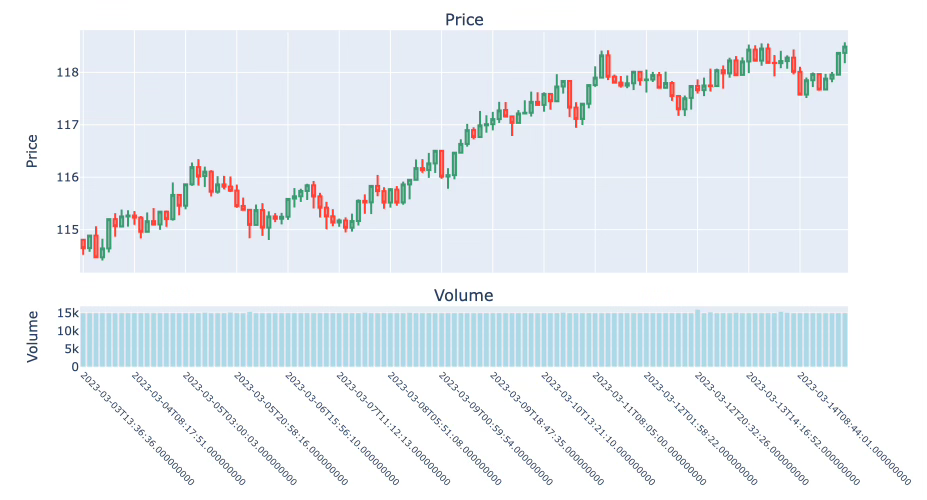
⚖️ 4. Imbalance Bars: Focus on Market Pressure
Unlike time, tick, or volume bars that aggregate by quantity or time, imbalance bars form based on the pressure between buyers and sellers.
🔄 What are Imbalance Bars?
There are two main types:
Tick Imbalance Bars (TIB): Count the number of buyer-initiated vs. seller-initiated ticks.
(using the tick rule: if price increases → buyer-initiated, if it decreases → seller-initiated)Volume Imbalance Bars (VIB): Sum the volume traded by buyers vs. sellers.
(Dollar Imbalance bars too but I do not use it a lot)
📐 How they work:
A new bar is created only when the cumulative imbalance (positive or negative) exceeds a predefined threshold. That threshold is typically dynamic and based on historical expectations.
💡 Why it’s powerful:
Captures event-driven market behavior (e.g., aggressive buyers flooding the book)
Helps detect hidden liquidity and large player footprints
Normalizes by information flow instead of time/volume → better for machine learning
✅ When to use:
In high-frequency trading or event-based strategies
To detect momentum bursts, liquidity voids, or initiated aggression
When time is not a useful anchor (e.g., after-hours, fragmented markets)
Imbalance bars don’t just reflect activity — they reflect intentions. They're particularly useful when volatility is chaotic or driven by hidden players.
➡️ In the one of the next newsletter, we’ll go further and explore two even more refined methods: Run Bars, which push imbalance logic to the extreme.
💻Code Example (for Volume Imbalance Bars from quantreo lib):
vol_imb_bars = da.bar_building.ticks_to_volume_imbalance_bars(df, expected_imbalance=50, col_price="price", col_volume="volume", additional_metrics=[])
🔍 5. And Beyond: What Comes After Imbalance Bars?
Tick, volume, and imbalance bars are already a huge step up from traditional time-based sampling. But the work of Marco López de Prado doesn’t stop there.
He also introduced more sophisticated bars:
📈 Run Bars (Tick/Volume)
Tick Run Bars (TRB): Triggered when a run of same-direction ticks exceeds expectations.
Volume Run Bars (VRB): Triggered when cumulative buy/sell volume in one direction surpasses the expected norm.
These bars are designed to:
Detect dominance streaks in order flow
Catch aggressive execution patterns
React faster to anomalous bursts of trading activity
But here's the deal:
⚠️ These bars aren’t yet available in Quantreo — and they’re harder to understand, implement, and calibrate correctly.
So we’re saving them for a dedicated future newsletter. When we do, we’ll explain:
The full intuition
The edge they might provide
How to implement them step-by-step
📩 Stay subscribed — they’re worth it.
If you want to go deeper, build smarter features, understand signal reliability, and master techniques like triple-barrier labeling, model understanding, or feature conditioning, that’s exactly what we cover in ML4Trading.
🚀 Whether you're coding your first models or scaling a live strategy, ML4Trading gives you the tools, templates, and theory to build robust and intelligent trading systems.
Thanks for reading, now it’s your turn to build the brain of your strategy.