

The Quantreo Library — A Guided Tour for Python Quants
The Python Library you need for quant trading! Features and target engineering in trading will be easier than you think.

Feature and target engineering is the backbone of any quant strategy — but let’s face it, it’s often a slow, repetitive, and error-prone process.
Quantreo was born out of that frustration.
It’s a Python library designed to help you build clean, high-performance features and targets fast — with rigor, consistency, and speed. Many functions are powered by Numba, making them up to 30x faster than standard Python code.
What used to take me 10 minutes now runs in under 20 seconds.
At launch (28th March 2025), Quantreo includes over 15 feature functions and 5 original targets, crafted from real-world trading insights — and many more are on the way (very soon).
This is just the beginning. The goal is simple: give quants a full-stack toolbox to accelerate research and build smarter models — without reinventing the wheel every time.
📚Find the Quantreo’s Python documentation here (with detailed tutorials).
1. What's Inside the Quantreo Library?
Quantreo isn’t just a set of random indicators — it’s a structured toolkit designed by the features I personally daily use.
At this stage, the library is divided into two main modules:
👉 Feature Engineering
👉 Target Engineering
Each module is carefully organized into sub-categories to help you work fast and think clearly.
1.1. Feature Engineering
Build advanced features beyond moving averages or RSI. You'll find categories like:
Candle Information: extract useful insights from individual or grouped candles.
Market Regime: detect shifts between trending and ranging phases.
Math-Based Features: apply quantitative transformations to price action.
Trend: capture directionality and slope-based movements.
Volatility: quantify and exploit expansions, contractions, and spikes.
1.2. Target Engineering
Predict what truly matters. Targets in Quantreo are grouped into:
Directional Targets: forecast up/down moves with clarity.
Event-Based Targets: label breakouts, compressions, or key market moments.
Magnitude Targets: predict not just the direction, but how far the move might go.
This structure gives you the flexibility to go from raw data to a clean, fully-featured dataset in minutes — ready for modeling, backtesting, or idea validation.
📥 IF YOU HAVE ANY IDEAS ABOUT A GOOD FEATURES OR TARGET YOU WOULD LIKE TO SEE IN THE QUANTREO’S LIBRARY, DROP IT IN THE COMMENTS!
2. Feature Engineering: The Model Core
Quantreo's feature engineering module goes beyond basic indicators — offering tools that capture volatility, memory, and adaptive trends with just a few lines of code.
Here’s a quick example using three powerful features:
import quantreo.features_engineering as fe
from quantreo.datasets import load_generated_ohlcv

# Import a fictive dataset from quantreo
df = load_generated_ohlcv().loc["2016"]

# Create features
df["rs_vol"] = fe.volatility.rogers_satchell_volatility(df, "high", "low", "open", "close", window_size=30)
df["hurst"] = fe.math.hurst(df, col="close", window_size=200)
df["kama"] = fe.trend.kama(df, col="close", l1=10, l2=2, l3=30)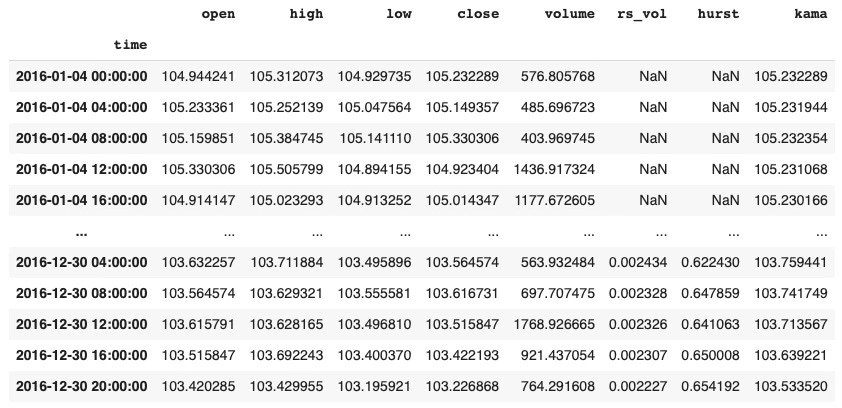
Rogers-Satchell volatility Measures volatility using open, high, low, and close, accounting for directional price movement.
Hurst exponent Quantifies the degree of long-term memory or randomness in a time series.
KAMA An adaptive moving average that adjusts to volatility to smooth price trends while staying responsive.
These features are designed for speed, clarity, and model-readiness — so you can go from raw data to predictive signals faster than ever.
Best of all, you can use it as input of scikit-learn and tensorflow models.
3. Target Engineering: What Are You Really Trying to Predict?
In supervised learning, your model is only as good as the target you define. That’s why Quantreo includes a dedicated target_engineering module, designed to help you craft precise, meaningful targets aligned with how markets actually behave.
Whether you’re predicting direction, magnitude, or reacting to market events, the goal is the same: translate raw price action into labels that truly reflect your strategy’s intent.
Let’s look at one example: identifying peaks and valleys in price, a powerful event-based target for capturing reversals or structuring entries and exits.
# Import the Target Engineering Package from Quantreo
import quantreo.target_engineering as te

# Create the target
df["label"] = te.event_based.detect_peaks_valleys(df, col='close', distance=10, prominence=1)

# Plot the target
price_col = "close"
plt.figure(figsize=(15, 6))
plt.plot(df[price_col], label='Price', linewidth=1)

# Display peaks (label == 1)
plt.scatter(df.index[df['label'] == 1], df[price_col][df['label'] == 1], marker='^', color='green', s=100, label='Peak (High)')

# Display valleys (label == -1)
plt.scatter(df.index[df['label'] == -1], df[price_col][df['label'] == -1], marker='v', color='red', s=100, label='Valley (Low)')

plt.title('Peaks and Valleys')
plt.legend()
plt.grid(True)
plt.xlabel('Time / Index')
plt.ylabel('Price')
plt.tight_layout()
plt.show()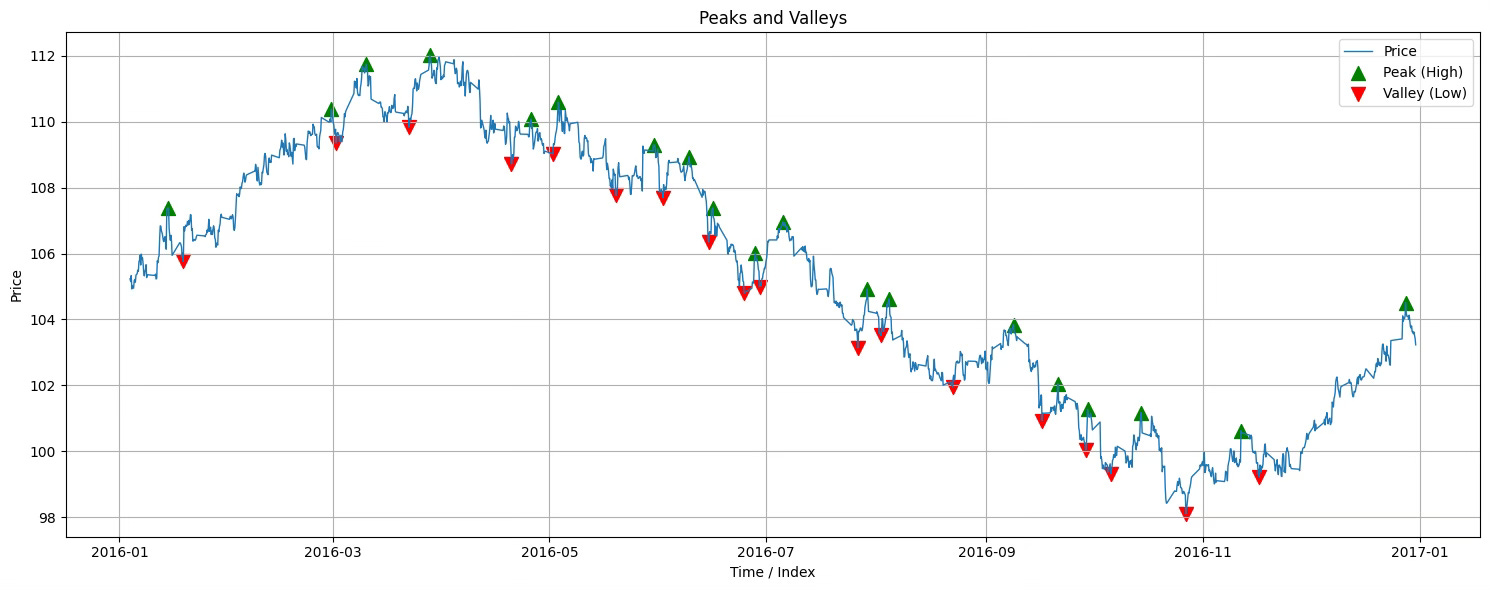
4. What’s Coming Next
This is just the beginning.
The next updates will bring more features, more targets, and the first tools for data preparation and model interpretation — so you can understand not just what your model predicts, but why.
After that? It’s up to the community. 👥👥
If there's something you want to see in Quantreo. A specific feature, a type of target, a visualization tool, let me know…
Drop a comment. Your feedback will shape the roadmap.
This first tour was short — and that’s normal. Quantreo is still young, but it’s growing fast.
The foundations are in place, and the roadmap is clear: more tools, more power, and more control for quants who want to build smarter.
Thanks for reading — and stay tuned:
Next week, we'll dive into how to (actually) use PCA in trading the right way.
Let’s build something great together🤝.