

Stop Trusting Your Backtests (Until You’ve Fixed These 5 Errors)
Learn why most backtests fail in live trading and how to fix them before it's too late.

Your strategy looks solid. The metrics are great. The charts are clean.
But here’s the hard truth: your backtest might still be completely useless.
Most traders think that once they hit “run backtest,” the results are gospel.
They tweak a few parameters, get a Sharpe ratio above 1, and think it’s ready for live trading.
It’s not.
In this newsletter, I’ll walk you through the 5 most common (and deadly) mistakes that turn promising strategies into broken illusions, and how to avoid them before it’s too late.
❌ Mistake 1: The One-Split Illusion
Most traders split their dataset once: 80% for training, 20% for testing.
Sounds reasonable, right?
It’s not.
That single cut introduces one of the most dangerous sources of bias: the variability problem.
All your backtest results, the Sharpe ratio, the drawdown, the cumulative return, depend entirely on that one arbitrary point.
Move the split just a few months forward or backward… and suddenly your strategy looks completely different.
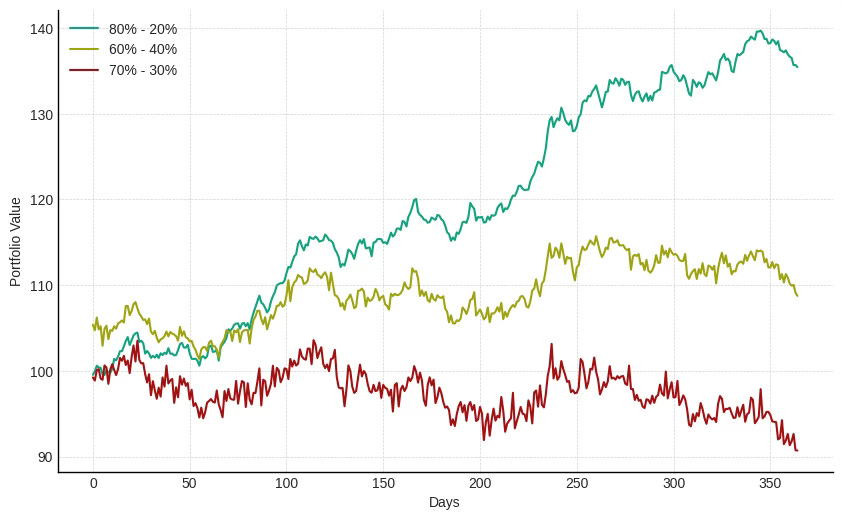
Figure: Backtest results taking different split points
You're not testing robustness. You're testing luck.
Different split, different results.
Different results, different decisions.
Even worse? You often use the latest data as your test set, which removes crucial information from your training period, exactly when markets start to shift.
✅ THE FIX
Use robust validation methods like:
Walk-Forward Optimization
Combinatorial Purged Cross-Validation (CPCV)
Monte Carlo subsampling
We’ll dive deeper into those in upcoming issues. But just know: one split is never enough.
❌ Mistake 2: Ignoring Transaction Costs and Slippage
Your backtest looks amazing.
500 trades over 10 years, a Sharpe above 1.5, and a smooth equity curve.
But let me ask you this:
Did you account for transaction costs? Slippage? Spread?
If not, your results are pure fantasy.
Even with a modest cost of 0.01% per trade, compounded over hundreds of trades, the damage adds up, fast.
And if you’re using high-frequency strategies or volatile assets? You’re probably not profitable at all.
Here’s the trap:
Backtests without friction are like racecars on paper fast, but not real.
✅ THE FIX
Add realistic costs per trade (fixed or percentage-based)
Include spread, slippage and latency buffers for execution
Always compare gross vs. net returns
Most “perfect” strategies collapse the moment you introduce a 0.05% cost.
If yours survives? You’re already ahead of 90% of retail quants.
❌ Mistake 3: Trusting Lucky Results
That strategy you just built?
With the 100% return and beautiful equity curve?
It might just be luck.
If you’re using a single train/test split, with no robustness testing, you’re not evaluating a strategy, you’re evaluating how lucky that one backtest run was.
Backtests can lie. Especially when you optimize hyperparameters, tweak signals, or test multiple versions.
You’ll always find one that performs great… by chance.
The better your backtest looks, the more skeptical you should be — unless it’s robust.
✅ THE FIX
Run Walk-Forward tests
Try Monte Carlo resampling
Use sensitivity analysis on all key parameters
Test across multiple market conditions
And most importantly: increase your backtest length
Even a perfect 1-year backtest means nothing.
Can your strategy survive 5 years? 10 years? With different regimes, crises, and trend phases?
If yes, now you’re onto something.
❌ Mistake 4: Ignoring the Number of Strategies Already Tested
Here’s a painful truth:
The more strategies you test, the more likely your “best one” is just a statistical accident.
Let’s say you test 100 different strategies on the same dataset.
Some will look amazing. That’s not alpha, that’s noise.
You’re not selecting the best strategy.
You’re selecting the luckiest one.
This is called multiple testing bias, and it’s the hidden killer behind many “great” backtests that blow up in live trading.
✅ THE FIX
Track the number of strategies tested.
Then apply a discounting rule to your performance metrics.
Simple version:
Where N is the number of strategies you’ve tested on the same data.
Example:
You tested 20 strategies → discount rate = 64%
So a Sharpe ratio of 1.2 becomes: 0.77
Still acceptable? Great.
If not? Time to rethink what “profitable” really means.
❌ Mistake 5: Ignoring Currency Risk
Let’s say you live in Europe.
You open a long position on Apple (AAPL), a US stock, at 08:15.
You close it at 16:30 with +11% on the stock.
But what’s your real return?
If the EUR/USD moved by -5% during that time, your actual gain isn’t 11% — it’s:
You made half as much — just because of the currency.
And in some cases? That “winning” trade becomes a loss.
✅ THE FIX
Always track returns in your base currency
Adjust prices or PnL by the relevant FX rates
Be especially careful when trading foreign assets, ETFs, or crypto pairs
Ignoring currency impact is one of the easiest ways to overestimate your strategy's performance, especially for global portfolios.
Don’t let forex ruin your equity curve.
🧠 The Real Solution? A Solid Backtesting Process
Avoiding mistakes is great, but what you really need is a repeatable, scalable process.
One that doesn’t just give you pretty metrics, but builds real confidence in your strategies.
That’s exactly what we teach in the Alpha Quant Program.
Inside, you’ll find:
A complete backtesting framework, from raw data to robust evaluation
Tools to build, test, and validate strategies the right way
Real-life projects to apply everything
And hands-on mentoring to stop guessing and start building like a quant
Because backtesting isn't about luck — it's about process.
And once you have the right one, everything changes.