

Predictability in Financial Time Series
How measuring uncertainty helps you separate signal from noise.

In trading, the challenge is not just finding patterns, it’s separating signal from noise. The more unpredictable and noisy a time series is, the harder it becomes to extract actionable insights.
Measuring entropy provides a way to quantify this uncertainty: low entropy suggests structure and potential predictability, while high entropy indicates randomness.
1. What is Entropy
Entropy is a measure of uncertainty or disorder in a time series. In trading terms, it tells us how much of the data behaves like pure noise versus carrying exploitable structure.
With the Quantreo library, you can compute entropy directly. For example, sample_entropy evaluates how repetitive a series is over time. Other measures such as spectral entropy (frequency-domain perspective) and permutation entropy(pattern complexity) are also available, offering different angles to assess predictability.
# Example with sample entropy on returns
df["returns"] = df["close"].pct_change(1)
df["sample_entropy_returns"] = fe.math.sample_entropy(df=df, col="returns", window_size=200)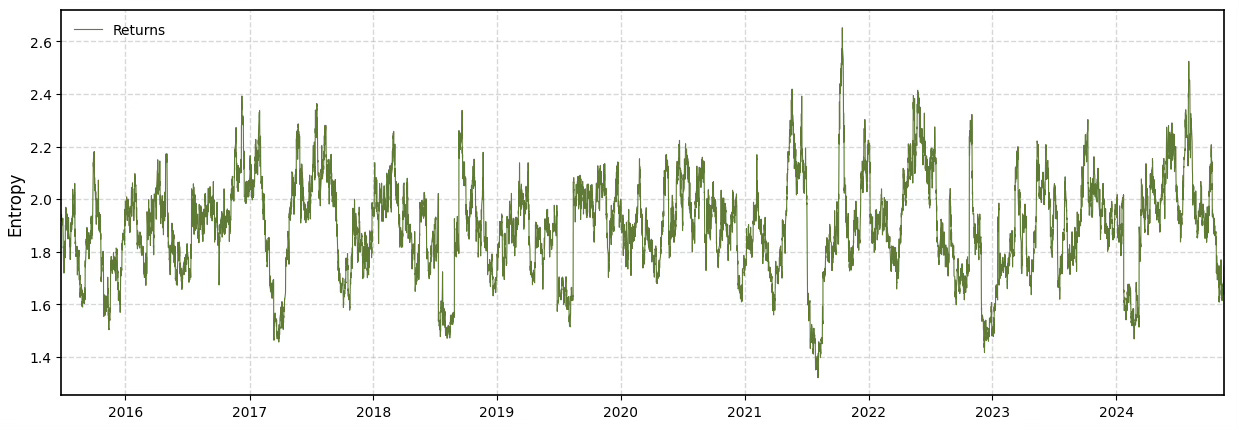
How to interpret it:
High entropy (> 1.5–2.0) → the series is close to white noise, hard to predict.
Moderate entropy (0.5–1.5) → some structure may exist, potentially exploitable.
Low entropy (< 0.5) → strong regularities, but beware of overfitting (patterns may not persist).
In practice, financial returns are often close to white noise. You can see this in the chart above: entropy values remain consistently high, confirming the empirical fact that raw returns are hard to predict.
2. Why it matters in Trading?
Entropy acts as a filter before you even start modeling. A series with high entropy is dominated by noise, any predictive model will struggle to extract reliable patterns. On the other hand, low to moderate entropy suggests there is some underlying structure worth exploring.
This does not mean low-entropy features will automatically generate profits. It simply means the information they carry is more exploitable if combined with the right models and strategy design. By measuring entropy early, you can save time by discarding signals that are statistically indistinguishable from randomness.
3. Application: Returns vs. Volatility
To see entropy in action, let’s compare two common financial series: returns and volatility.
Returns typically behave like white noise. Their entropy is consistently high, confirming their low predictability.
Volatility, however, exhibits persistence and clustering effects. Its entropy is lower, meaning it carries more exploitable structure.
In the chart below, you can clearly see this difference:
Returns entropy (green) fluctuates around higher levels.
Volatility entropy (brown) remains much lower, showing stronger patterns over time.
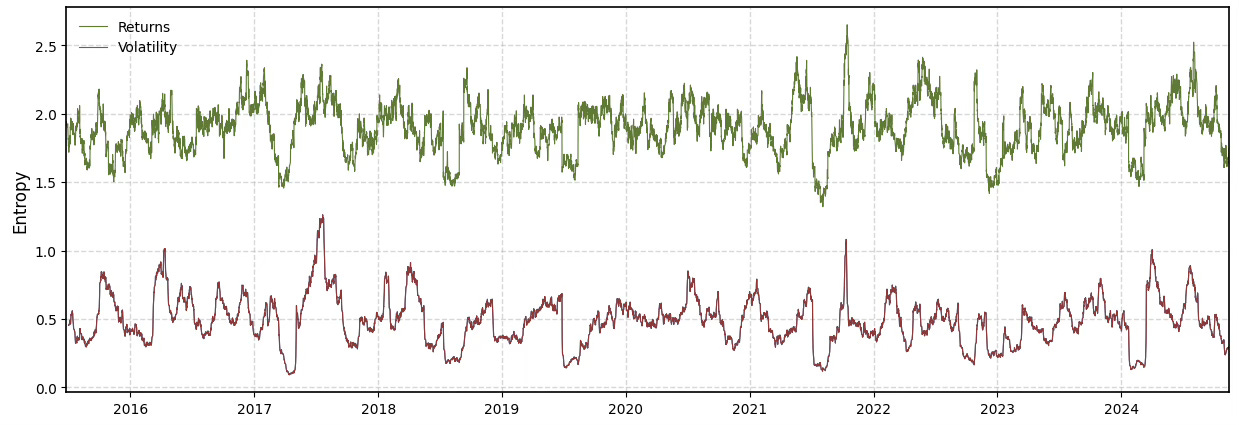
This contrast highlights a key lesson: not all features are equal. Measuring entropy helps prioritize which signals deserve deeper analysis.
4. Practical Takeaway
Entropy won’t tell you how to trade, but it will tell you whether a signal is worth your time.
High entropy → likely noise, discard or deprioritize.
Moderate entropy → may contain useful patterns, explore further.
Low entropy → highly structured, but validate carefully to avoid overfitting.
By checking entropy first, you avoid wasting hours modeling features that are indistinguishable from randomness. It’s a simple but powerful filter to keep your research focused on information-rich signals.
👉 If you want to go deeper into each step of the strategy building process, with real-life projects, ready-to-use templates, and 1:1 mentoring, that’s exactly what the Alpha Quant Program is for.
Brilliant post.
Thank you Lucas!
Great post!