

Multi-Asset Feature Engineering in Financial ML
Why Your Indicators Might Be Lying to You — and How to Fix It for Cross-Asset Machine Learning.

Think your indicators are giving you solid signals?
Now imagine applying them across multiple assets... and watching your model fall apart.
❌ Welcome to the hidden trap of multi-asset machine learning.
In this article, we’ll show you why features like KAMA and volatility can mislead your model when applied blindly across assets with different price scales and regimes.
But here’s the good news:
We’ll also show you how to fix it, step by step, and the method works for any feature.
This isn’t about tweaking parameters.
✅ It’s about building features that actually generalize.
Let’s dive in.
1. 🎭 The Illusion of Reliable Indicators
“Same formula, different signals.”
You’re using the same indicator, on different assets?
Same code, same parameters… everything identical!
But the outputs? Totally disconnected.
Take KAMA or volatility.
Apply them to six assets, and you’ll get six completely different ranges, amplitudes, and patterns.
Not because the indicator is broken — but because it doesn’t account for price scale or volatility regime.
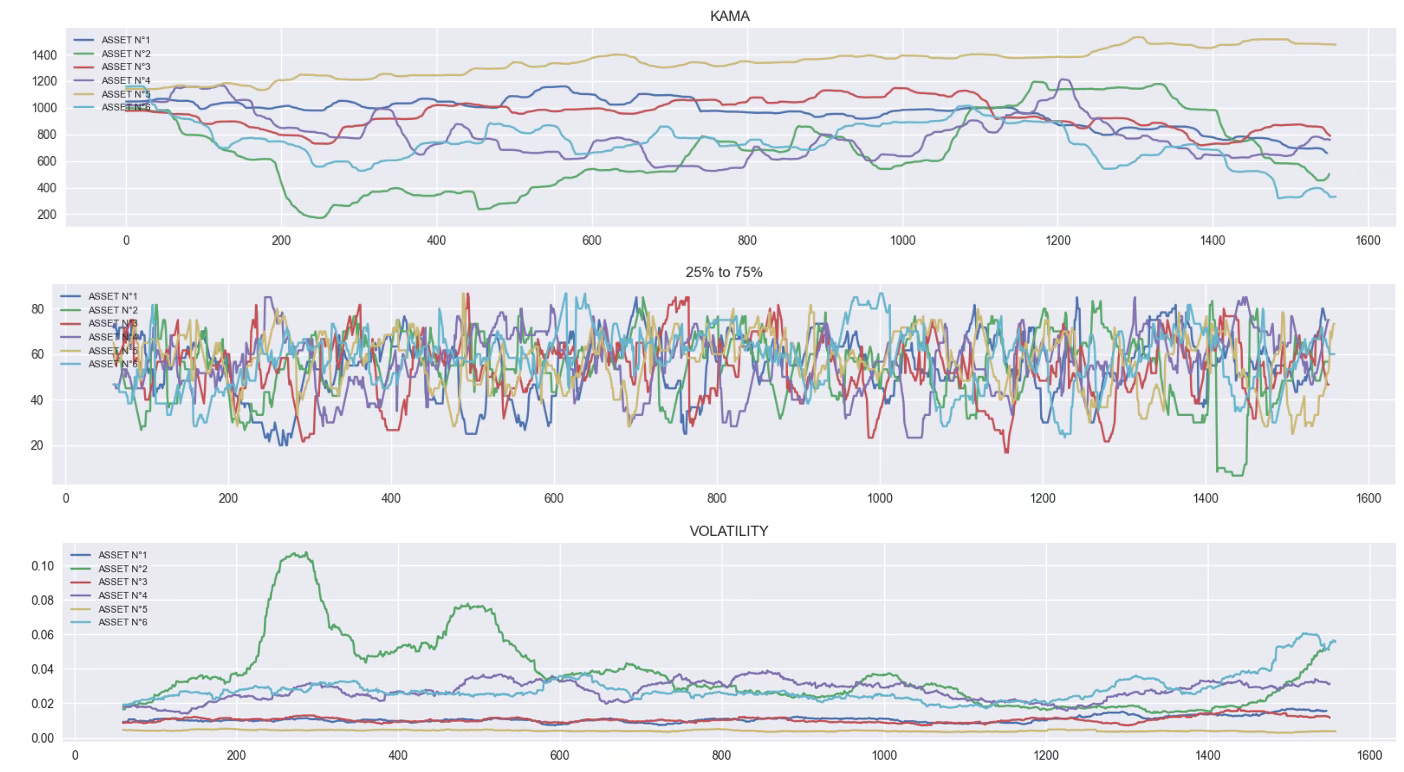
Your model can’t possibly generalize if the same feature means “+0.5% signal” on one asset and “+10% trend” on another.
And yet… not all features suffer from this.
Some, like the 25% to 75% range, are naturally bounded and scale-independent.
They work right out of the box, whether your asset trades at 10 or 10,000.
That’s your first takeaway:
Not all features are broken, but most aren’t plug-and-play.
2. 📉 The Root Cause: Raw Features Aren’t Comparable
“Your model isn’t confused, it’s misinformed.”
When features like KAMA or volatility explode or flatten across assets, it's not bad luck.
It’s physics. Well… almost.
Most technical indicators are built to track behavior,
but they’re usually tied to the absolute level of price or volatility magnitude.
⚠️They were never meant to feed a machine learning model.
As we just saw, the same feature can output values in the hundreds for one asset…
and stay stuck around 0.01 for another.
You can’t throw that into a model and expect it to learn anything useful.
At best, it memorizes noise.
At worst, it anchors its decisions on the asset’s price level, which has no predictive power.
The fix?
Stop feeding it absolute values.
Start feeding it relationships.
3. ⚙️ Step 1 — Make It Relative
“We don’t care how high — we care how it moves.”
Raw values lie.
But ratios tell the truth.
Instead of looking at the value of a KAMA or a volatility indicator,
we look at how it evolves relative to a slower version of itself.
Example:
diff_kama = (kama_20 - kama_120) / kama_120diff_vol = (vol_60 - vol_120) / vol_120
Now you’re no longer saying:
“The volatility is 0.08 on asset A and 0.002 on asset B.”
You're saying:
“Volatility just doubled compared to its 120-period average — regardless of the asset.”
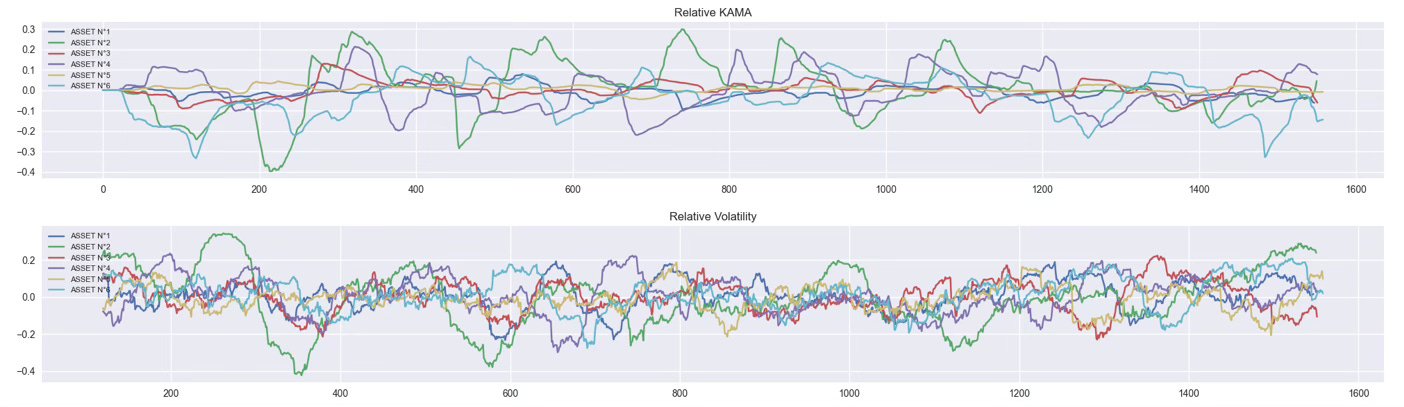
And it works.
✅ All assets now fluctuate around 0.
✅ Signals are bounded.
✅ Behavior is finally readable.
But one problem remains…
Some features are still nervous, others barely move.
⚠️For example, Asset N°5 (yellow curve) is much flatter than Asset N°6 (turquoise curve).
So even though both features are now centered, it’s still hard for the model to interpret them consistently.
We fixed the baseline.
Now it’s time to fix the scale.
4. 📏 Step 2 — Standardize It
“Now everything speaks the same language.”
t this point, all our features are centered around zero.
But their amplitude still varies wildly from one asset to another.
Some curves are tight and controlled.
Others are volatile and spiky.
That’s a problem, because machine learning models are sensitive to scale.
And you don’t want your model to think Asset N°6 is more “important” than Asset N°5 just because its feature fluctuates more.
The fix?
Apply a good old Z-score: Z = (x - μ) / σ
Each feature is now centered at 0, standardized with variance 1 and finally comparable across all assets.
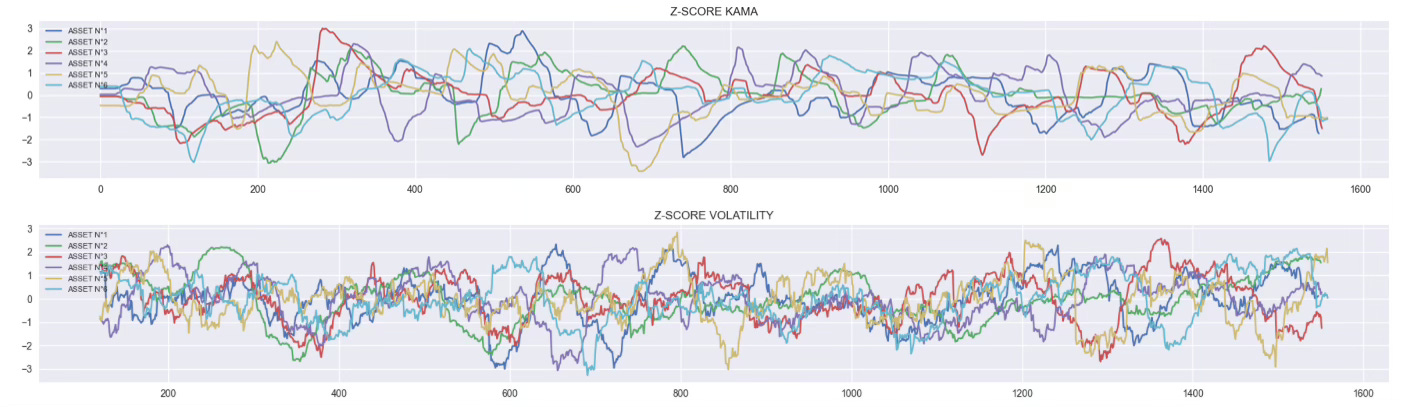
This is the moment where your dataset stops being noise
and starts becoming signal.
5. 🚧 Pro Tips — Scaling the Right Way
“The model sees what you feed it. Don’t cheat.”
We’ve talked about Z-score, but you can also use a Min-Max scaler if you prefer your features bounded between 0 and 1.
Want to make it more robust?
Use the 1st and 99th percentiles instead of the true min/max, it protects you from outliers without breaking the scale.
But whatever method you choose, here’s the rule:
🧠 Always compute your scaling on the training set only.
That means:
Use
meanandstdfrom the training set (for Z-score),Or
min,max, or percentiles from the training set (for Min-Max).
Then apply those same parameters to the test set.
If you don’t, you’re leaking future information into your model.
And that leads to artificially good performance and zero real-world reliability.
📌 In this article, we skipped that part for clarity.
But in production, don’t cut corners — your model will thank you.
6. ✅ Final Words — From Raw Noise to Cross-Asset Signal
“Now you're not just building features. You're building understanding.”
You started with indicators that looked fine on a single asset…
but broke the moment you went multi-asset.
Step by step, you turned raw, inconsistent signals into relative, bounded, and standardized features. Ready for modeling.
Now your data is clean. Your features are aligned.
And your model?
It can finally focus on learning patterns, not fighting scale issues.
This workflow works for KAMA and volatility but it applies to any indicator you use: RSI, MACD, Bollinger Bands, or custom indicators.
So next time your model underperforms, ask yourself:
Are my features talking to each other, or speaking different languages?
💻 Want to take a look to the code? Click here.
I always look forward to your newsletter. Best in town at the moment. I always learn a thing or two to apply to my current projects. Thank you so much Lucas