

Max Drawdown Is a Distribution, Not a Number
Why the worst loss in your backtest tells you almost nothing about the worst loss you should plan for, and how a block bootstrap makes the gap visible.

Most track records report a single max drawdown and treat it as a property of the strategy. A risk memo states the max drawdown is 12 percent, and that figure gets used as if the next one cannot be worse without something breaking. It can. That 12 percent is one realization of a path dependent statistic, not a ceiling.
Max drawdown is more fragile than almost any other metric, because it depends on the ordering of returns, not their average. It lives in consecutive loss sequences. Resample that sequence while respecting its structure and the full distribution appears. On the trend strategy below, the observed drawdown sits in the lower tail, and the 95th percentile scenario is roughly 1.5x worse, with nothing changed in the strategy itself.
1. Why max drawdown is the most fragile number in your backtest
Mean, volatility, Sharpe are averages. Reshuffle your returns and they barely move. Max drawdown is a function of the path: it depends entirely on the order in which losses arrived, because it measures the deepest peak to trough the equity curve reached.
Same returns, same Sharpe, different ordering, different drawdown. Cluster the losses and it deepens, spread them out and it shrinks. So the observed max drawdown is one realized path out of many the same process could produce, closer to a sample maximum than to a stable parameter. Reporting it as a fixed risk limit treats one lucky or unlucky ordering as the boundary of what the strategy can do.
The fix: estimate its distribution by resampling the return stream, while preserving the loss clustering the drawdown lives on. That last constraint is where the bootstrap choice becomes the whole game.
2. Resampling the drawdown
The idea is one sentence: resample the strategy’s return stream in blocks, rebuild the equity curve, take its drawdown, and repeat a few thousand times. The spread of those drawdowns is the distribution the single number was hiding.
Two constraints carry the result. Blocks, not single points: drawdowns live in consecutive losses, so resampling contiguous chunks preserves the clustering that an iid resample destroys and understates. And each resampled path keeps the original length, since max drawdown grows mechanically with the window. One note on interpretation: this holds the strategy fixed and varies only the ordering, which is exactly the question here, how much could sequencing alone have moved my worst loss.
On the trend strategy used here, the observed max drawdown is 17.9 percent. The bootstrap median is 15.7 percent, the 95th percentile is 26.9 percent. The worst loss actually observed sits near the middle of the distribution, and the severe scenario is roughly 1.5x deeper, with nothing changed in the strategy.
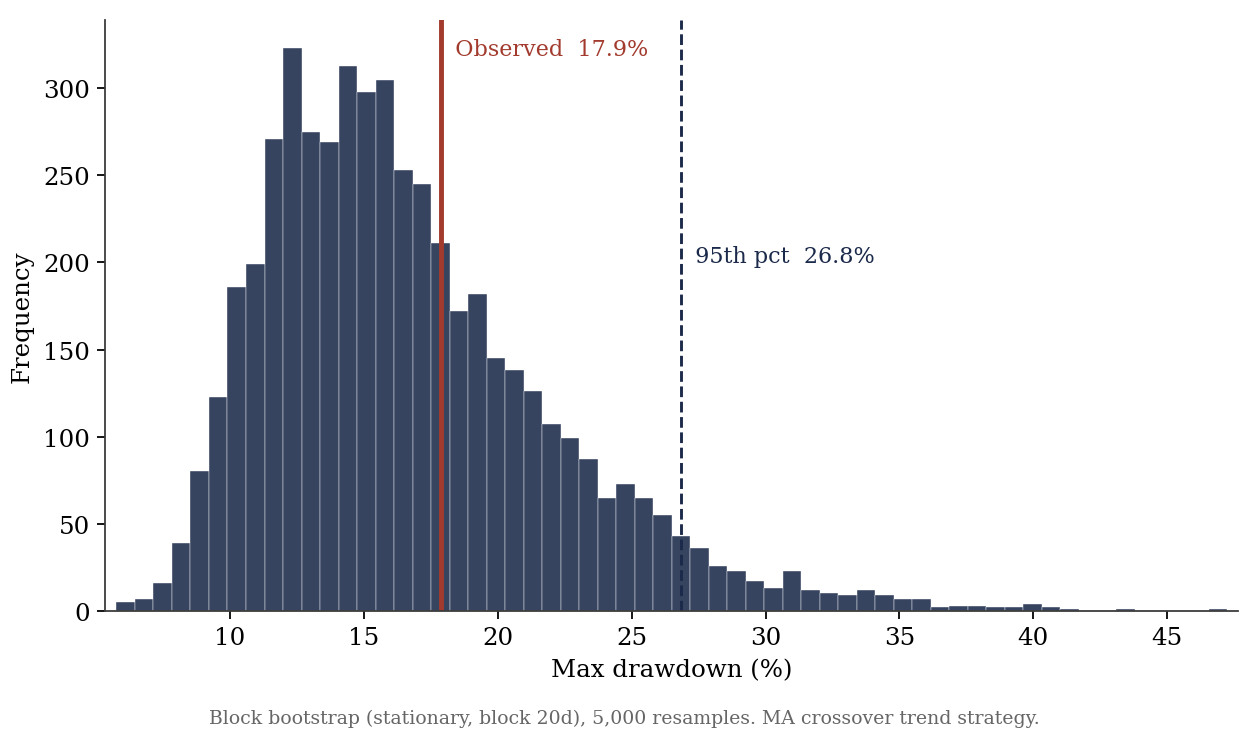
The reading is direct. The observed drawdown is a typical draw, not a ceiling. Risk sizing should reference the 95th percentile, not the historical worst: a book you would run at one level of leverage on a 17.9 percent drawdown looks different once a 27 percent drawdown is inside its normal range.
3. One trap, and the takeaway
A tempting variant is to bootstrap the price series instead, rebuild the path, then re-run the strategy on it. It looks equivalent. It is not. For a trend follower with a short block length, resampling prices scrambles the long sequences the signal relies on, so the strategy stops seeing the trend. On the same example, the Sharpe collapses from 0.56 to 0.02. That approach answers a different question, whether the edge survives a reshuffled market, and it is a useful test on its own. It is not a measure of drawdown uncertainty, and the two should not be confused.
The takeaway is the same line we started with. Max drawdown is a draw, not a property. The honest version of a track record is not “the worst loss was 17.9 percent” but “the worst loss was 17.9 percent, and a 27 percent drawdown is well within the normal range of this strategy.” Size the risk on the distribution, not on the single path history happened to hand you.
How to define a block size that makes sense?
Good shit, thank you.