

Is Your Trading Bot Losing Its Edge?
From Overfitting to Market Shifts: When It’s Time to Pause a Trading Strategy

People talk a lot about building a trading bot, a bit less about knowing when to pause it. But that decision is just as important.
Having an edge is great. Keeping it is better. But the truth is, sometimes your edge fades. Maybe because the market changed, maybe because your backtest was overfit, or maybe it was never really there to begin with.
In this newsletter, I’ll walk you through a few ways to spot those moments when it makes sense to stop running a strategy. Not based on gut feeling or yesterday’s PnL but with concrete, statistical tools. It won’t be perfect, but it’s better than flying blind.
1. Statistical Change Detection: Is It Still the Same Strategy Distribution?
If your trading algorithm is behaving the same way as it used to, then its performance distribution should be relatively stable over time.
But if recent returns show a significant shift, you might no longer be trading the same strategy and you should treat it accordingly.
1.1. Why Compare Two Periods?
You split your performance into two distinct parts:
Period 1: the reference phase - backtest or early live trading
Period 2: the recent phase - the last month or quarter
Your hypothesis: both come from the same distribution (mean, volatility, shape).
Your goal: test whether this assumption still holds.
If not, this could suggest a structural change in the strategy or in the market.
1.2. T-test vs Mann-Whitney U Test
Depending on your assumptions, you can use:
T-test: if you assume returns are normally distributed
Mann-Whitney U Test: if you want a non-parametric alternative
Example in Python:
from scipy.stats import ttest_ind, mannwhitneyu
import numpy as np

# Simulated performance
past_returns = np.random.normal(loc=0.001, scale=0.01, size=250)
recent_returns = np.random.normal(loc=-0.0005, scale=0.015, size=60)

# T-test
_, t_pvalue = ttest_ind(past_returns, recent_returns, equal_var=False)

# Mann-Whitney U test
_, u_pvalue = mannwhitneyu(past_returns, recent_returns)

print(f"T-test p-value: {t_pvalue:.4f}")
print(f"U-test p-value: {u_pvalue:.4f}")
A p-value below 0.05 indicates that the recent returns are statistically different from the past, your strategy may no longer behave the same way.
1.3. One More Option: CUSUM
CUSUM is a method designed to detect structural changes in the cumulative performance over time. If you suspect a gradual or abrupt regime shift, it’s worth looking into, we won't cover it in detail here, but it’s a useful tool to add to your toolbox.
2. Generalization Error: When Expectations and Reality Diverge
Even if your backtest is solid, the real challenge begins when the model goes live. That’s when you find out whether it can generalize.
2.1. What Is Generalization Error?
Generalization error is the gap between:
Expected performance: from backtests or early live trading
Observed performance: from recent live trading
The larger the gap, the more your model is failing to adapt to real data.
This isn’t about just one bad week — it’s about whether the model is consistently underperforming its expected behavior, beyond normal fluctuations.
2.2. Visual Check: Live vs Expected Range
One of the easiest ways to start is to visualize your live performance against the expected performance distribution.
You can compute a confidence interval (e.g., 95%) around your backtest or early live results, then compare the recent returns.
Example in Python:
import numpy as np
import pandas as pd
import matplotlib.pyplot as plt

# Assume these are the daily returns during backtest
backtest_returns = np.array([...])  # Replace with your real data

# Compute empirical 95% confidence interval
lower_q = np.percentile(backtest_returns, 2.5)
upper_q = np.percentile(backtest_returns, 97.5)

# Assume this is the series of live returns
live_returns = np.array([...])

# Plotting
plt.figure(figsize=(12, 4))
plt.plot(live_returns, label="Live Returns", color="black")
plt.hlines([lower_q, upper_q], xmin=0, xmax=len(live_returns),
           colors="red", linestyles="dashed", label="95% Confidence Band")
plt.legend()
plt.title("Live returns vs. expected confidence interval (non-parametric)")
plt.show()
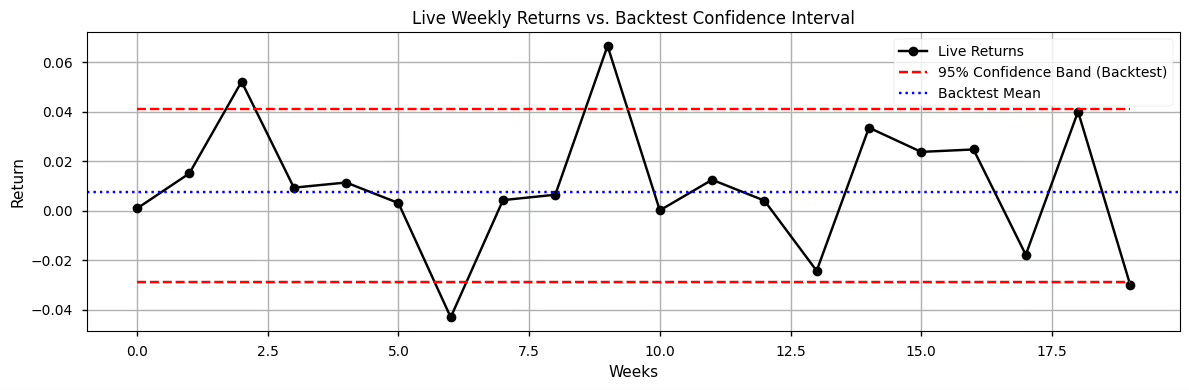
👉 When you have several and consecutive point outside the confidence interval, the strategy may have lost its edge.
3. Observed vs. Expected Drawdowns
Not all drawdowns are created equal. Some are routine, others are statistically suspicious.
The point here is not just to panic because the equity curve is dipping it’s to check how unusual that dip is, compared to what your strategy has historically endured.
3.1. Why drawdowns matter
Drawdowns are not just a psychological test. They are statistical artifacts.
Each strategy has its own drawdown profile: how deep, how long, and how frequent.
If your current live drawdown is worst 95% of the drawdowns seen in your backtest (in depth or duration), that might be a sign something has changed.
The logic is simple:
If drawdowns in the backtest rarely went below -10%
And your current drawdown is -17% and growing…
Then you're probably in a regime shift, or your strategy is degrading.
3.2. When to worry
You shouldn’t exit just because there’s a drawdown. But if it’s:
Longer than 95% of historical drawdowns
Deeper than what you’ve seen in backtest and live combined
And not associated with any known external regime change…
Then yes, it’s time to investigate. Maybe stop, maybe retrain, maybe reduce exposure.
What matters is that this decision is driven by data, not emotions.
4. What to Do When the Edge Fades
Once you’ve identified that your strategy may no longer be behaving as expected — whether through statistical tests, generalization gap, or abnormal drawdowns — the next step is not to panic, but to act with control.
Here are your main options.
4.1. Reduce your exposure
You don't have to go from full live trading to zero. Start by scaling down.
Cut the position size in half. If the strategy recovers, you can scale back up. If not, you’ve limited the damage.
4.2. Move to simulation (or paper trading)
If the warning signs keep piling up, stop trading real capital and move the strategy to a paper environment.
You’ll continue to track its performance in live conditions, without taking real risk.
This helps answer:
"Is this a temporary slump or a structural change?"
4.3. Investigate the root causes
Sometimes it’s not the model’s fault — it’s the market that changed.
Start by checking:
Has volatility changed?
Are spreads wider?
Did the microstructure evolve (latency, order flow)?
Are news or macro cycles disrupting the signal logic?
Some strategies break temporarily because the conditions they depend on disappeared.
Others break permanently because the edge was never robust.
Understanding which one you’re facing is key.
If you want to go deeper, build smarter features, understand signal reliability, and master techniques like triple-barrier labeling, model understanding, or feature conditioning, that’s exactly what we cover in ML4Trading.
🚀 Whether you're coding your first models or scaling a live strategy, ML4Trading gives you the tools, templates, and theory to build robust and intelligent trading systems.
Thanks for reading, now it’s your turn to build the brain of your strategy.
Thanks for writing these very practical advice posts.
How is the approach different from monte Carlo data to do the same? Assuming monte carlo also just uses the same backtest data to simulate the distribution.