

How Many Strategies Have You Really Tested?
Discount your metrics. Upgrade your validation. Save yourself months of fake hope.

I see a lot of backtests showing impressive results. And every time, I ask myself one thing: how many strategies were tested before finding this one?
Because the real challenge isn’t finding a strategy that looks good on paper. It’s knowing whether it works for the right reasons.
When you test dozens or hundreds of strategies on the same dataset, at least one of them is bound to look great, even if none of them actually have edge. That’s the problem of multiple testing bias, or what I like to call lucky randomness.
And it’s not a small problem. It can fool you into thinking you’ve found something solid when you’ve really just stumbled into noise that looks like signal.
In this newsletter, I’ll walk you through why this matters, how to think about it (without diving into heavy math), and how to adjust your performance expectations to account for it.
Not to be perfect. Just to avoid fooling yourself.
This post was inspired by the “Backtesting” paper by Campbell R. Harvey and Yan Liu, which explores the risks of overfitting and multiple testing in strategy evaluation.
1. Why Testing More Strategies Doesn’t Always Help
When you try too many strategies on the same dataset, you’re almost guaranteed to find something that looks good. Not because it’s a great idea but just because one of them got lucky.
It’s the same logic as running a bunch of statistical tests. If you test enough times, something will pop up. Doesn’t mean it’s real.
In backtesting, this happens all the time. You tweak indicators, add filters, test new rules… and eventually, you hit a “winning” strategy. But if you had tried 200 variations, it’s probably just the best fit to the noise.
You’re not picking the best strategy. You’re picking the best coincidence. It is called the multi-testing bias.
That’s why so many strategies collapse as soon as you go live. The edge wasn’t there it was just a good story the data told you once.
What we need is a way to account for that. A way to say: “OK, this looks good but how much should I trust it, given how many things I tested?” That’s what we’ll look at next.
2. The Problem of Lucky Strategies (a.k.a. Multiple Testing)
Let’s say you test 100 strategies on the same dataset. Even if none of them truly work, some will still look good, just by random chance.
It’s the same logic as running multiple A/B tests or flipping a coin 100 times. Eventually, you’ll get a streak of heads. Doesn’t mean the coin is special.
When you test many strategies, you're doing multiple statistical tests. So the chance of finding a false positive, a strategy that looks profitable by accident, increases fast.
This is what the literature calls data mining bias or lucky randomness. And it’s dangerous, because:
The “best” strategy from your tests might just be a fluke.
Its performance won’t repeat in live trading.
You won’t know until it's too late.
There’s even a clean formula to express this risk. If pV is the probability that one strategy performs well by luck, and you test N independent strategies, the chance of at least one false discovery is:
Even if pS is small, when N grows, this probability quickly explodes. That’s why large-scale strategy testing without correction is almost guaranteed to give you false confidence.
So, how do we fix that? That’s what the next section covers.
3. So What Can You Do? Apply a Metric Discount
Once you understand that some of your “good” strategies are probably just lucky, the question becomes: how do you adjust for it?
One simple and practical solution: discount your performance metrics based on the number of strategies you’ve tested on the same dataset.
The idea is straightforward. If you test more strategies, you should trust your best one less. Its Sharpe ratio, return, or win rate might be inflated by chance.
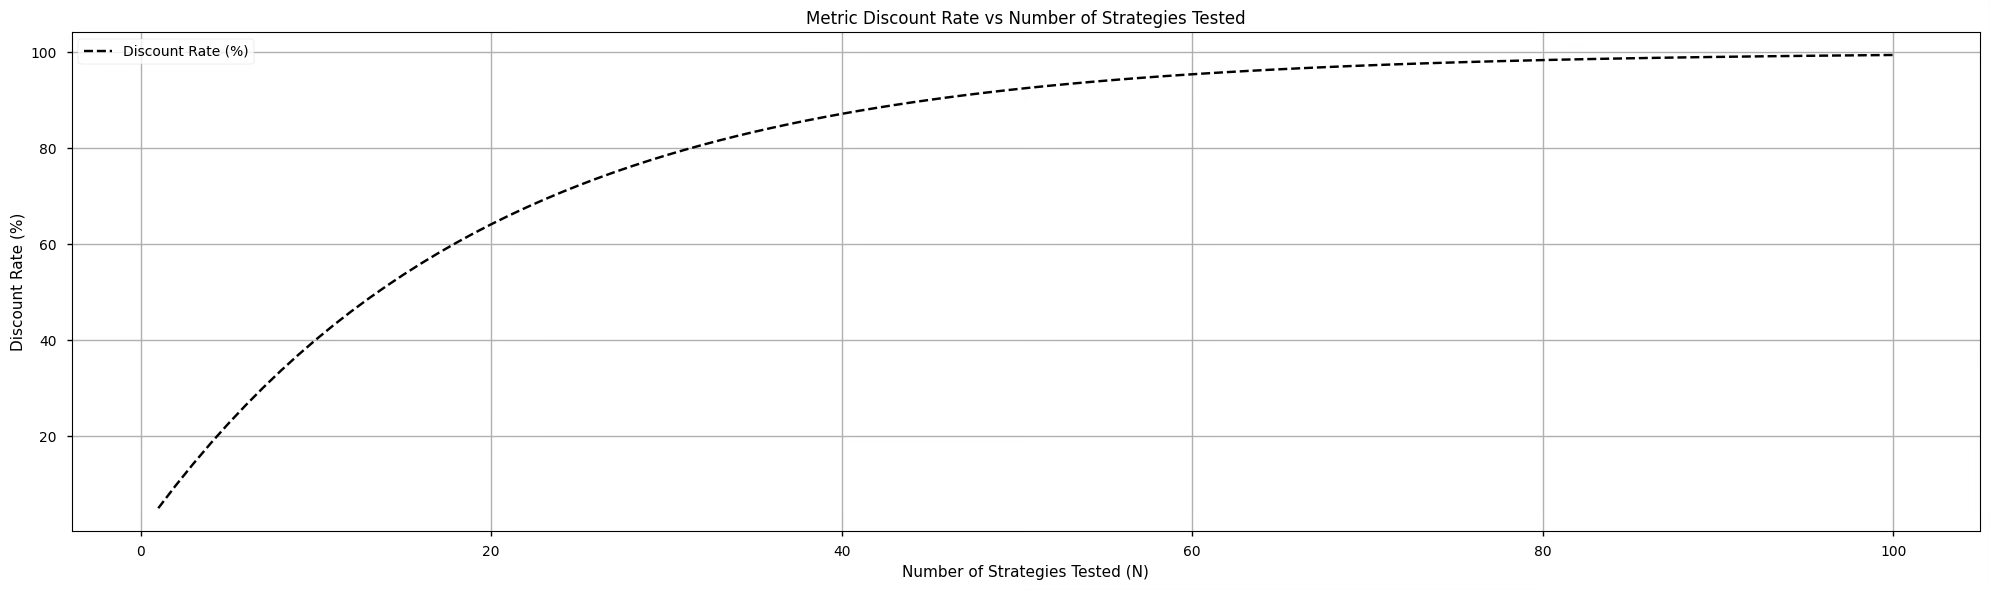
You can apply a discount factor to your metrics using the following formula:
Where N is the number of strategies you tested.
For example, if you tested 20 strategies:
N = 20
discount_rate = 1 - 0.95**N # ~64%
So if your Sharpe ratio is 1.20, the discounted Sharpe would be:
discounted_SR = 1.20 * (1 - discount_rate) # ~0.43It’s not perfect, but it’s much better than blindly trusting the top performer.
This method is directly inspired by what’s proposed in the paper by Harvey & Liu on backtesting.
You can apply it to any metric you want to maximize (return, Sharpe), and invert it for metrics you want to minimize (drawdown, volatility).
I would not recommend you to discount the win rate as it will lead to a complete non sense.
Here is a small graph showing the discount rate according to the number of strategies tested.
And yes, it's conservative. But that's the point. Better be skeptical upfront than surprised later.
But many other ways are explained in the article, so I really advise you take a look to it.
4. What If You Actually Do Things Right? (CVPC, Monte Carlo, Walk-Forward)
Here’s the good news: not all testing is equal.
If you’re using more robust validation methods, like:
Combinatorial Purged Cross-Validation (CVPC)
Monte Carlo backtesting
Walk-forward analysis
…then the chance of stumbling onto a “lucky” strategy goes down.
These methods force your model to prove itself across multiple variations of the data. They break temporal leakage, avoid overfitting to a single test set, and make it harder for randomness to sneak in.
So what does that mean for your performance discount?
You can apply a smaller one.
Because the better your validation pipeline, the lower your odds of being fooled by randomness. You’ve earned a little more trust in your numbers.
If you want to go beyond pretty backtests and build strategies that actually survive live markets, the Alpha Quant Program was made for you.
You’ll learn how to apply Combinatorial Purged Cross-Validation (CVPC), run Monte Carlo backtests, and design proper walk-forward analysis. All to build a scientific and repeatable validation process for your trading ideas.
But that’s just the beginning.
You also get mentoring from Lucas, real-world quant projects, data pipelines, live trading setups, and even “storm-mode” scenarios to stress-test your entire system.
No more toy examples. No more guesswork.
This is the toolkit you need to go from quant enthusiast to quant engineer.
BIBLIOGRAPHY
Harvey, C. R., & Liu, Y. (2015). Backtesting. Duke I&E Research Paper No. 2014-06. Available at SSRN: https://ssrn.com/abstract=2345489