

Filtering Noise, Finding Structure
A robust statistical approach to understanding how assets synchronize during stress.

Financial data is anything but “normal.” Markets don’t move in smooth, Gaussian patterns, they jump, spike, and synchronize under stress. In calm periods, relationships between assets appear stable; during crises, correlations suddenly converge, and diversification evaporates.
Understanding how and when this synchronization happens is one of the hardest yet most valuable challenges in quantitative research. But before studying these dynamics, there’s a deeper question to solve: how do we handle extreme values without distorting reality?
This newsletter explores a simple framework for outlier handling and crisis synchronization analysis, a method designed to preserve genuine market structure while filtering the distortions that noise and panic inject into data.
The result is more than a “cleaned dataset.” It’s a new lens for interpreting how markets breathe, align, and break under pressure.
Associated Notebook: Link
👉 If you want to go deeper into each step of the strategy building process, with real-life projects, ready-to-use templates, and 1:1 mentoring, that’s exactly what the Alpha Quant Program is for.
1. Context
During stable market conditions, assets tend to move independently, and traditional statistical tools perform well. But once volatility spikes, those assumptions collapse.
Crises act as natural stress tests for both markets and models. They reveal how risk truly propagates across instruments, asset classes, and even time zones. Yet most analyses are biased by extreme values: a few large moves can completely reshape a covariance matrix or distort a factor model.
To study the real structure of crisis behavior, we need a framework that resists these distortions, one that filters noise without erasing information. Robust statistics provide exactly that foundation: they allow us to observe systemic synchronization without being misled by transient, isolated shocks.
This context sets the stage for the method presented next, where outlier handling and synchronization analysis are combined into a unified, data-driven approach to understanding collective market dynamics.
2. Problem Statement
Traditional statistical techniques often assume that financial returns are symmetrically distributed and independent across time. In reality, markets exhibit fat tails, volatility clustering, and regime shifts, features that amplify noise and obscure structure.
When extreme movements occur, they do not only distort single-asset statistics; they cascade through the system, creating temporary spikes in correlations that may not reflect genuine relationships. This makes it difficult to distinguish between two fundamentally different phenomena:
Outliers caused by isolated events or microstructure noise.
True crisis synchronization where multiple assets respond collectively to systemic stress.
The challenge, therefore, is twofold:
To isolate meaningful patterns from transient shocks without over-smoothing the data.
To measure cross-asset dependencies in a way that remains stable and interpretable across regimes.
This requires a methodology that is both robust and dynamic, robust enough to resist the influence of extreme values, and dynamic enough to detect evolving patterns of synchronization during crises.
3. Methodology
The methodology combines robust statistical filtering with dynamic synchronization analysis. The goal is to preserve the underlying structure of market relationships while mitigating the distorting effects of extreme values.
Step 1 – Robust Outlier Detection
Instead of relying on mean–variance assumptions, the method uses robust estimators such as the Median Absolute Deviation (MAD), Interquartile Range (IQR), or robust z-scores. These approaches reduce the impact of extreme returns without altering the local dynamics of the series.
This step identifies abnormal observations, potential outliers, while preserving genuine market movements.
Step 2 – Controlled Reconstruction
Once the extremes are detected, they are soft-adjusted rather than removed. Techniques such as winsorization or robust smoothing limit extreme deviations while keeping continuity in price evolution.
The result is a dataset that retains structural information and temporal coherence, a crucial aspect when studying cross-asset dependencies.
Step 3 – Crisis Synchronization Analysis
With cleaned data, correlations and co-movement metrics are recalculated using both classical and robust measures.
In calm regimes, both methods produce similar results.
During stress periods, robust measures reveal how correlations surge and markets synchronize.
This comparison highlights not just the strength of relationships but their resilience to distortions, a more meaningful indicator of systemic connectedness.
Step 4 – Visualization and Interpretation
Dynamic heatmaps, rolling correlation matrices, and co-movement indices are used to visualize how synchronization evolves through time.
These visual tools expose the propagation of shocks across assets and help identify when and how fast contagion spreads during crises.
4. Example and Results
To demonstrate the method, we compare the relationship between two assets before and after robust filtering. The scatter plot below illustrates how extreme observations distort the perception of correlation.
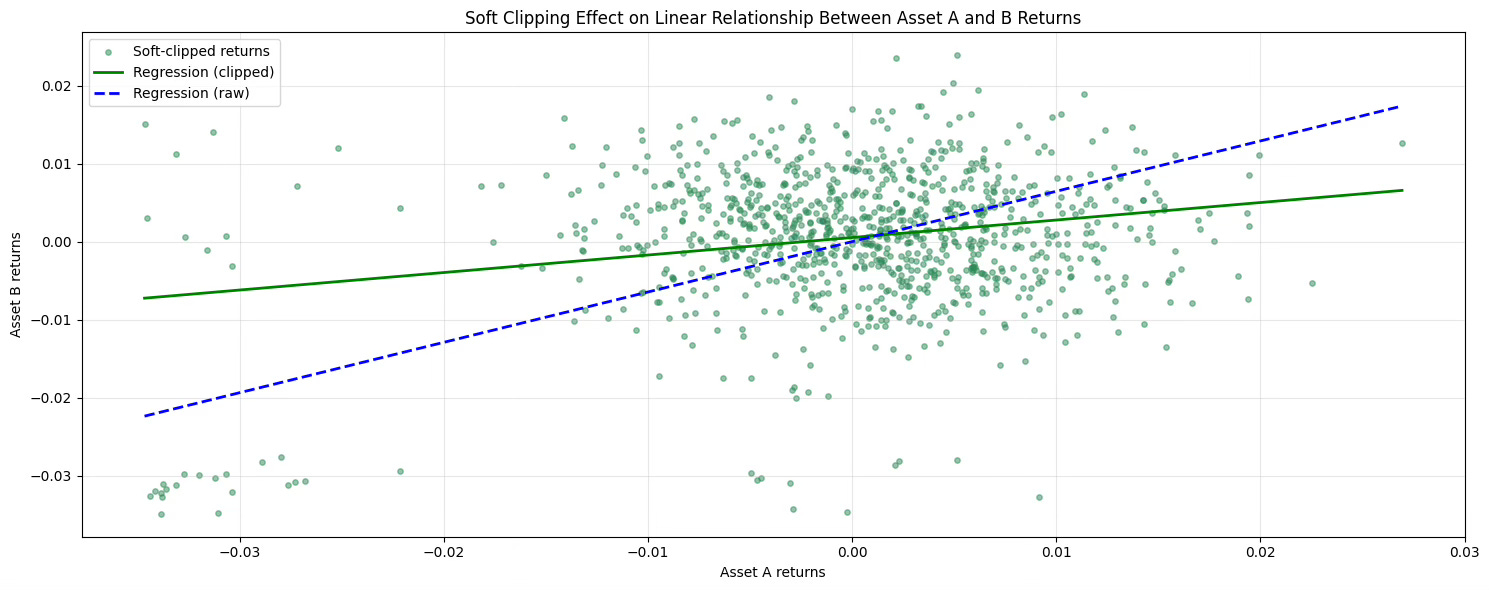
In the raw data, a few outliers pull the regression line sharply upward, suggesting an exaggerated dependency between assets. After applying the robust filtering, the second regression (in blue) captures the true structural relationship, less steep, more stable, and consistent with the overall distribution of points.
This simple visual highlights the entire idea: robust preprocessing doesn’t just remove noise; it restores interpretability.
Once outliers are controlled, the synchronization between assets reflects real co-movement rather than statistical artifacts.
Robust statistics are not merely a cleaning step, they’re a lens for understanding reality.
By controlling the influence of extremes, we can see how markets truly synchronize under stress, revealing structures that traditional methods obscure.
This approach transforms crisis analysis from reactive observation to proactive insight: instead of chasing noise, we learn to interpret the rhythm and coherence of collective market behavior.
In the end, robustness is not about removing data, it’s about preserving meaning.
👉 If you want to go deeper into each step of the strategy building process, with real-life projects, ready-to-use templates, and 1:1 mentoring, that’s exactly what the Alpha Quant Program is for.